Making menu changes can seem like a gargantuan undertaking. Rest assured, it doesn’t have to be. The key to shrinking this sizeable task down is ensuring the right plate costing solution is in place. Pair that data with what you can get from your point-of-sale (POS) system and you’ll have everything you need to optimize your menu.
“It’s crucial to make menu decisions based on the data,” emphasizes Matt Dyksterhouse, Gordon Food Service Customer Technology Supervisor. “It takes the subjectivity out of the equation.”

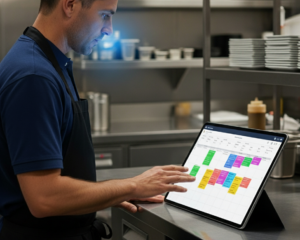
Start with your plate costing solution
But what should you look for in a plate costing solution? Dyksterhouse outlines these five key components and why they’re important:
- Accounts for real-time pricing so you can more accurately assess profit margin.
- Executes batch recipes first and plated recipes second. “What good is the price of a pasta dish if it doesn’t include the marinara sauce?” he offers by way of explanation.
- Segments your menu by daypart and/or season so you can get plate costs for the full menu, cost out multiple menus at once, look at what’s most profitable and uncover additional opportunities to drive sales.
- Includes bulk recipes for catering menus and events, offering you scalability to manage your inventory and price according to size.
- Adjusts for seasonality to guide price changes in line with relevant events, customs and holidays.
“Having all of these features will make your life, and your decisions, much easier,” Dyksterhouse surmises. “They’re included in Recipe Manager, a tool available to Gordon Food Service customers, so they can generate their plate costs down to the penny and identify opportunities to streamline.”
Having the solution isn’t enough, though. Take it one step further and make sure everything added to it is accurate. “The most common mistakes I see are duplicate items and miscategorization,” adds Scott Thompson, Gordon Food Service Business Solutions Specialist. “You can’t get reliable data if the data isn’t right to begin with.”

Dive into your POS data
Once you have accurate plate costs, you can review your POS data. Very basically, POS data will tell you what’s selling, what isn’t selling and report on other various aspects of sales like check averages per server and per guest. Your job, as an operator or manager, is to peel the curtain back and look past what’s in front of you to determine if you’re making money.
“Really all a POS system is doing is collecting activity information. From there, you need to put your thinking cap on and sift through it,” says Jim Milliman, Gordon Food Service Business Solutions Specialist. “That means looking at dayparts, menu parts, modifiers and sides.” Doing this type of cross-examination with your plate costs allow you to pick apart your menu to reveal what’s profitable and where you may just be trading dollars.

Analyze your full menu
A full-blown roll your sleeves up, lock yourself in your office assessment of your menu should be conducted at least once a year, ideally twice a year. But, there are three exceptions to this recommendation:
- Major economic shifts.
- Significant competition moving into the area. “If you know three restaurants are going to open around you, you’d want to analyze your menu to make sure that it’s positioned strongly,” suggests Milliman.
- Volatile labor market. If you have to bid up wages to retain or hire staff, you need to look at the other half of the equation to figure if and how these changes will impact your plate costs.
Scrutinize the two Ps of each menu item: performance and profitability
Everything on your menu should be categorized one of four ways. Take action based on where each item falls.
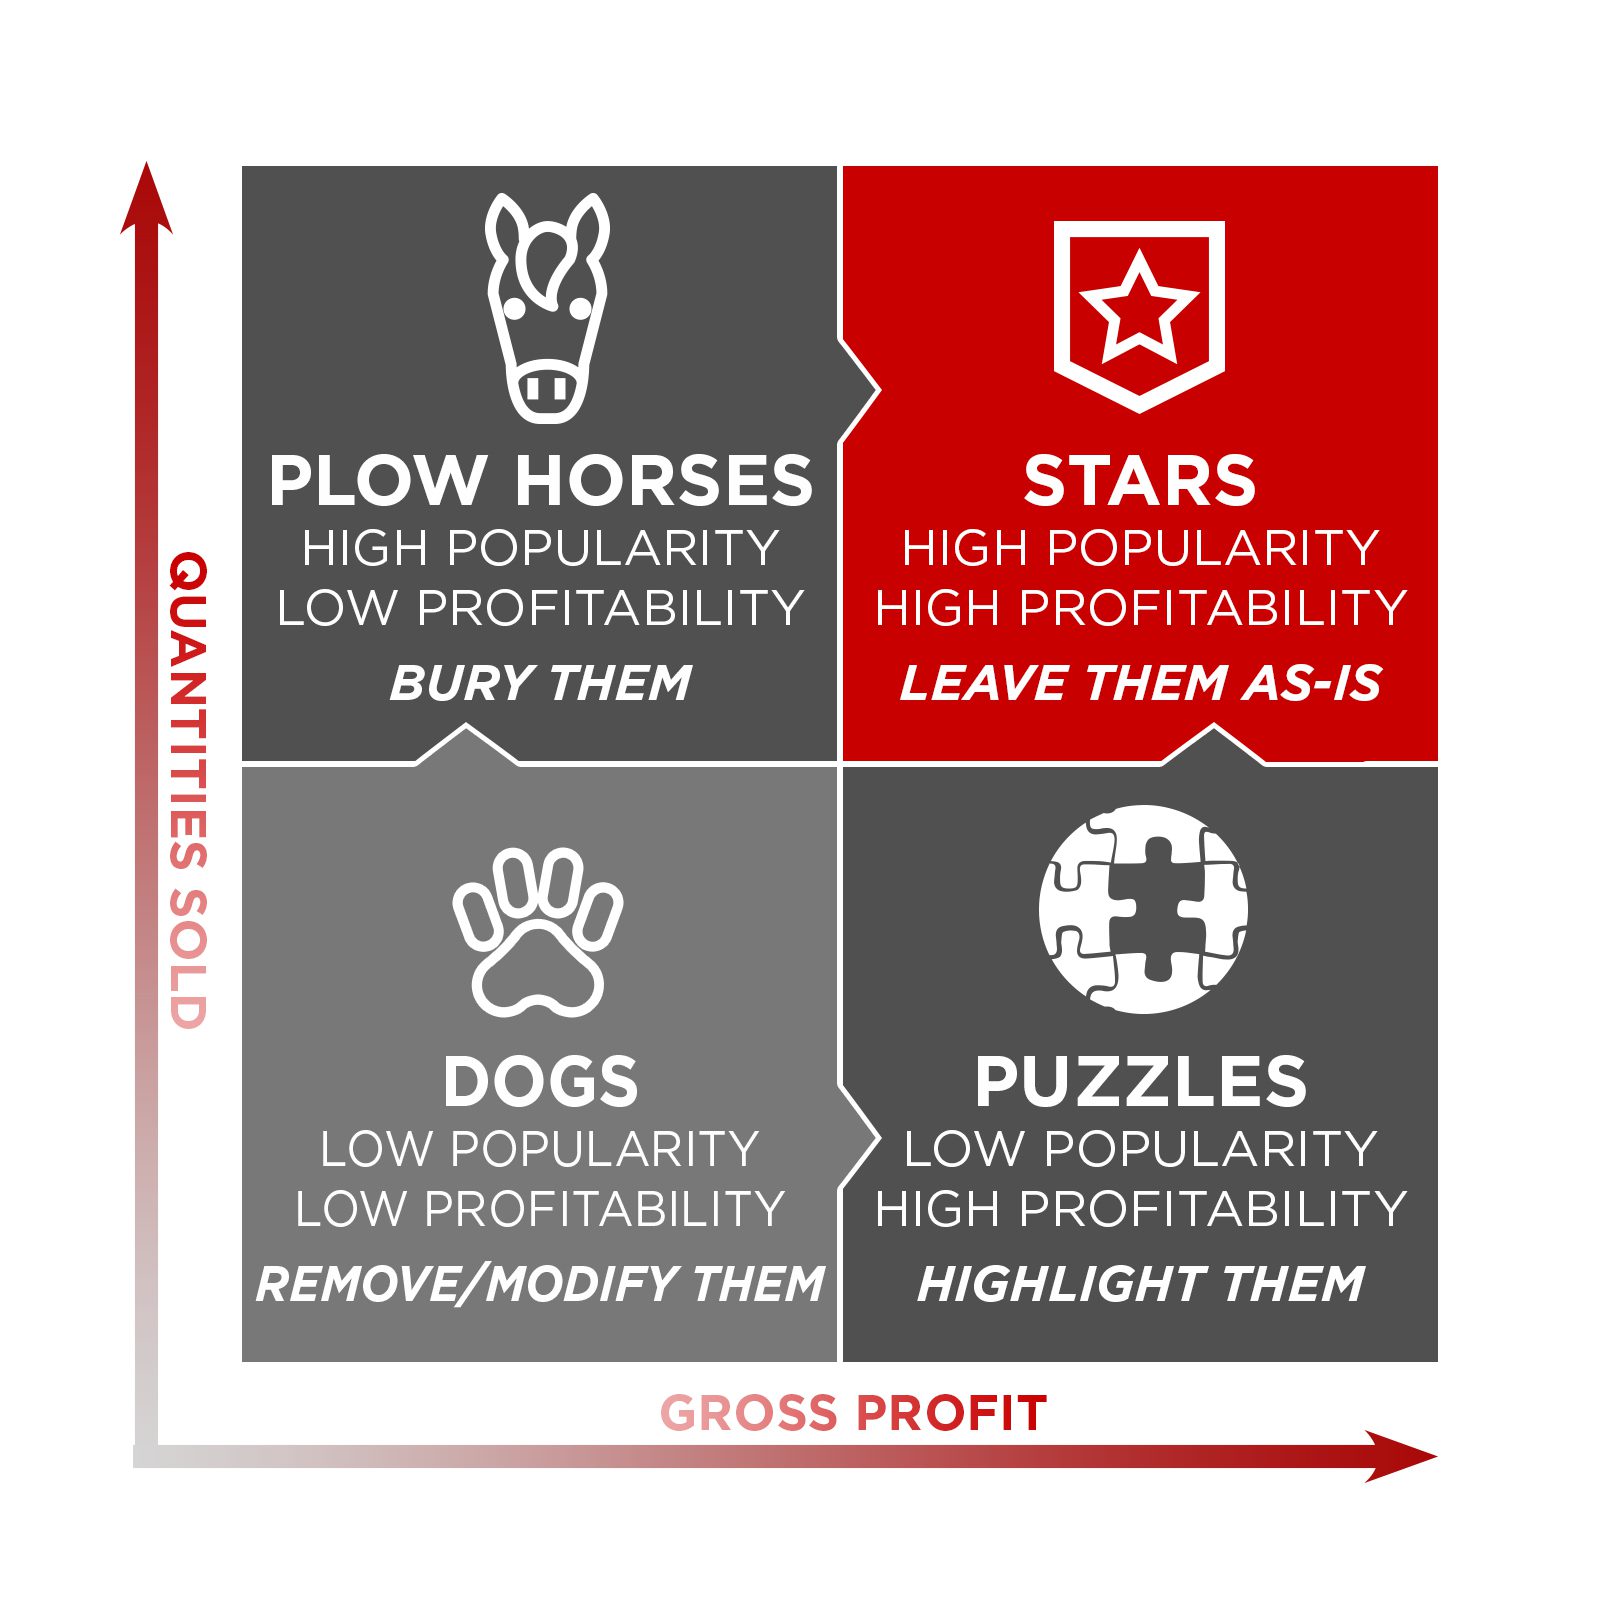
Time consuming? Yes. Complicated? No. Milliman explains, “If an operator looks at their data and determines that they can get an extra $1.89 out of their menu 125 times a day, 365 days a year, that adds up to over $85,000. The power of this analysis lies in simple math like that. If they have the data and take the time to analyze it, they can uncover those types of opportunities.”


